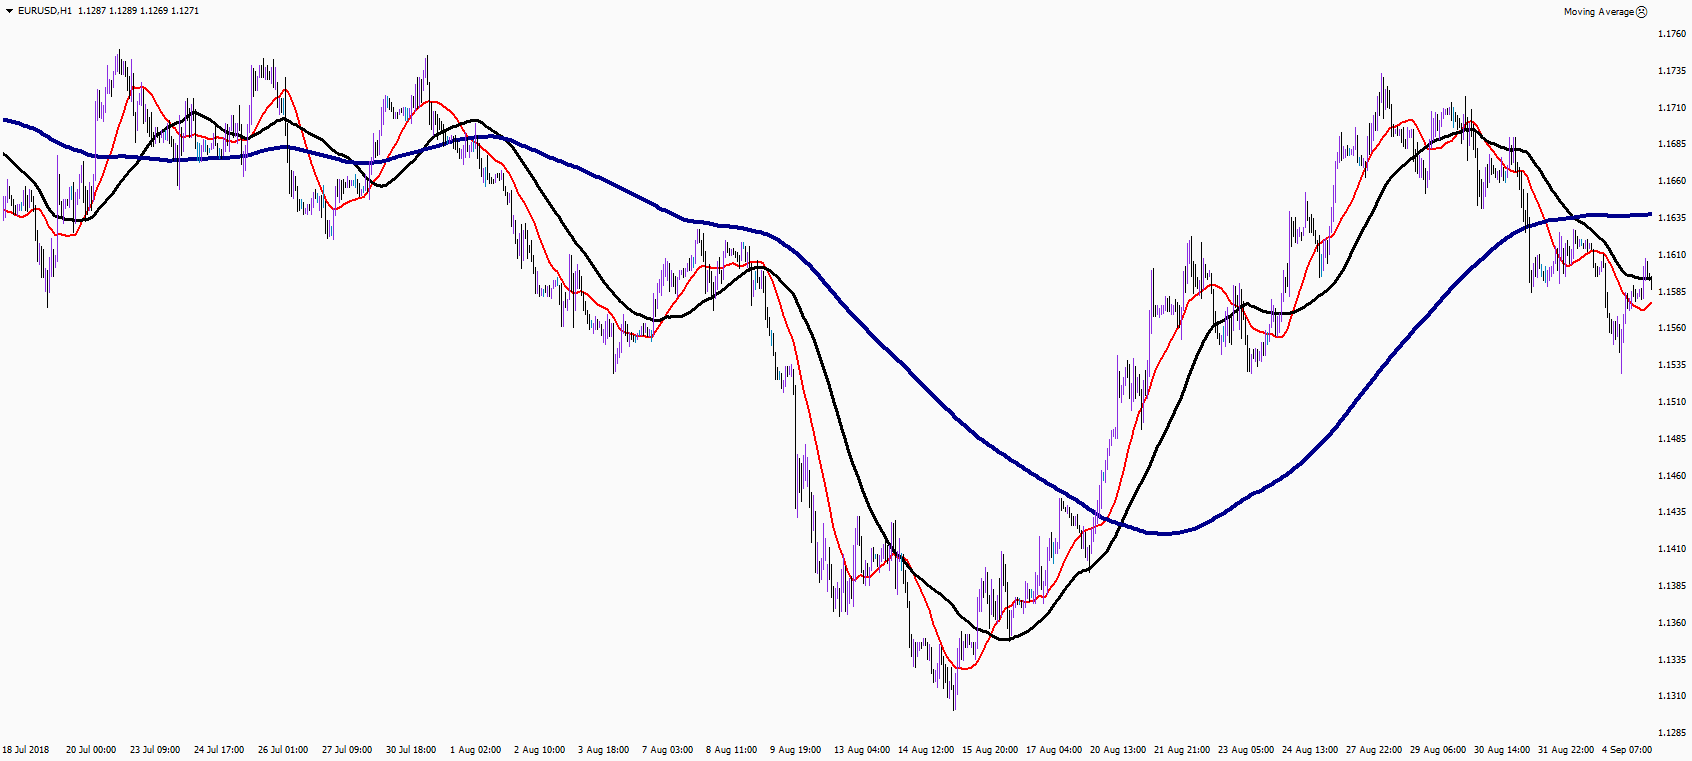
Reliability of the MA’s signal is determined by the number of calculation periods. The more periods are used, the more reliable the signals becomes.
Other Forex MA Indicators
One of the simplest and well-known indicators is the simple moving average (SMA). In addition to SMA, there are some indicator options that are widespread and presented in most trading platforms.
-
Exponential (Exponential Moving Average, EMA). In contradistinction to the simple one, which makes no difference between calculated price periods, the EMA indicator add more value to most recent data. From the close of the current price, the value decreases exponentially from the first most sensitive bar to the last calculated one, which has practically no effect on the trend calculation. The EMA algorithm allows you to respond faster to market changes in order to trade more effectively on small timeframes.
-
Linear Weighted (Linear Weighted MA, LWMA, WMA indicator). Modification of the EMA moving average with a different algorithm for assigning the significance (weights) of periods. As well as with EMA in LWMA the last bar has the greatest weight, then the significance decreases in relation to the exponential one. It reacts even more to drastic price changes, which is why it is more used in the stock market, where trends are initially smoother than in the volatile Forex market.
-
Smoothed MA (SMMA). Works in the opposite way: older periods have more weight and the value of current bars decrease sequentially. Thus, the movement of the smoothed MA becomes more resistant to small price fluctuations.
How to use the Moving Averages Indicator
MA’s settings can differ depending on the strategy you use, but there are general basic principles for using moving averages in trading with any financial instruments.
Choose the right period for MA.
Analysing the angle of inclination Moving Average. The greater the angle of inclination of MA is, the stronger is the potential for the financial instrument to rise or fall.
Moving Averages in Action:
-
Using MA as a trend line. In order to use MA as a trend line you need to choose the right MA characteristics. If price is located higher than MA, there is a bullish trend in market, and vice versa.
-
Determine momentum with MA. Momentum is basically trend speed. The easiest way to determine market momentum is to plot three MAs on the chart and observe how they relate to each other. There is strong momentum if the price stays up and MAs line up one after another, in order of precedence from top to bottom: 20, 50 and 200. If MA lines intercept between each other and the price, there is an indication of flat market.
-
Support and resistance. A popular option is use MAs as support/resistance lines. Usually traders use MAs with round values, such as 20, 50, and 100.
-
MA interception. Bullish intersection of moving averages occurs when a faster line (with lower period parameter) crosses the slow one (with larger period parameter) upwards. A bearish moving average crossing occurs when the fast line crosses the slow one from top to bottom.


