Bullish Candlestick Formations
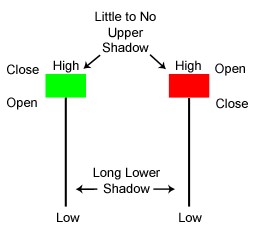
Hammer -
it is a very strong bullish signal when it occurs after a significant downtrend. The candle has a small body and a long wick. The body can be clear or filled in.
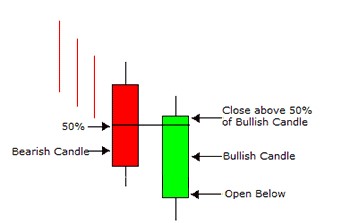
Piercing Line -
the first candle is a long bear candle followed by a long bull candle, signaling buyers are coming into the market.
Bullish Engulfing Lines -
it is a strongly bullish pattern if it occurs after a significant downtrend. The first bear candle is engulfed by a large bullish candle. It may serve as a reversal pattern.
Bearish Candlestick Formations
Hanging Man -
the hanging man is identified by small candle bodies and a long wick below. It might serve as a bearish signal if it occurs after a significant uptrend.
Dark Cloud Cover -
a bearish pattern, which gains mores significance if the second candle's body is below the center of the previous candle's body.
Bearish Engulfing Lines -
it is defined by a small bullish candle is engulfed by a large bearish candle. It is strongly bearish if it occurs after a significant uptrend.
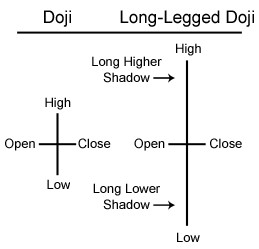
Doji -
a classic reversal pattern. It has the same opening and closing price, which makes it look like a cross or a T. The T shaped Doji is also known as a Dragonfly Doji, while an inverted T is known as a Tombstone Doji. It might also communicate indecision, when the range between the high and the low is relatively small.